
In case you still don't understand why you should mask up to save your neighbors, here's another take. Sorry, but there's no good way to shorten it.
For starters, we can decide to be forgiving to those who did not understand the numbers at the beginning. Logistical (S-shaped) phenomena are very hard to spot at the beginning, and only specialists are likely to notice them. (Call this Phase One.) If the potential problem goes against our personal goals, we are inclined to ignore or scoff at them. The number of new cases daily remained under 100 until March 3, and by that date only 14 people had died.*
As the growth and the growth rate both accelerate, the process becomes noticeable even to non-specialists. (Call this Phase Two.) The monthly death totals accelerated: End of March 3,170; April 60,966; May 103,781; June 126,140; July 152,070; August 183,069; September 206,007. On April 16, a staggering 4,928 deaths were reported, and supplementary reports indicate that Covid-19 was a contributing factor in hundreds more in which a pre-existing condition had weakened the patient.
At some point there is a recognition that action is needed. In the case of Covid-19, authorities began to see that intervention including personal isolation was a major key to slowing the spread of the disease. Still the numbers soared. This point was not reached until April or May in most parts of the US. (Call it Phase Three.) It is marked in the graph by the peak in April, after which preventive measures took hold in the urban areas that had been the epicenters in Phases One and Two.
As the number of cases and the number of medical providers gaining experience with therapy, the death rate from the disease (deaths/cases) has declined during Phase Three, but will probably never reach zero. Thus it is necessary to examine the "latent deaths" that will inexorably happen in the future. That current average rate is about 3.5 percent since the end of January; it is about 2.3% for the last month (Sep 10 - Oct 10). Using that last number gives projections in the range 420 to 483 thousand deaths by Inauguration Day and as many as 517,000 by the end of 2021. It is also possible (and experts say likely) that additional spread and its "latent deaths" will constitute a second wave that could equal or surpass the first.
This all clearly happened in the case of the current pandemic in early 2020. It was abetted by officeholders who covered their ears when the experts whispered. The decline in daily deaths after the spring due to improving therapy and social distancing measures let deniers claim the danger was past, ("we're winning, turning the corner, rounding the curve," etc.), while the virus just kept coming.
Today October 10, the 14-day average deaths stand at 681, suggesting an October toll of over 20,000 Americans. Although the impact of the pandemic is clear, some political leaders continue to attempt to "balance" health and economic concerns to the benefit of neither.
Line by line
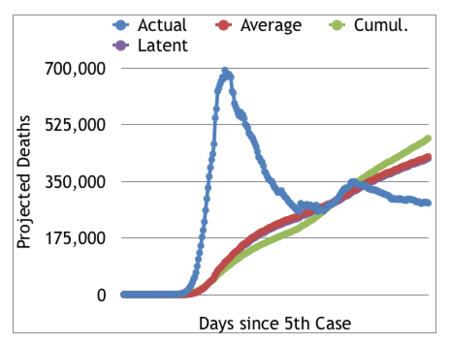
In the adjacent graph (click it to expand), the blue line shows the projected Inauguration Day (ID) deaths as the number to date plus that day's deaths multiplied by the remaining days to ID. Phase One starts at left and continues to the April 24 peak. The Administration seems to like the blue line, which falsely indicates that the pandemic is receding. The graph continues predicting deaths ending with the data for October 10.
The green line replaces the current day with the 14-day moving average of deaths. The red line replaces the current day with the average of all daily deaths. Both show deaths continuing to rise beyond the period of the analysis (we could extend beyond January 20, but it would just make you worry or even vote for Biden).
A black "latent" line appears alongside the red, showing the effect of the "unsatisifed" deaths to be expected among persons currently infected, giving a similar result to the average daily and cumulative rates. No matter which way one slices, it smells bad.
The "true" expected deaths in the analysis for January 20 lie somewhere between 282,000 and 484,000. Your chances of Covid-19 are somewhere between one in 282,729 and one in 483,373. Feeling lucky? (1:282K is about ten times more likely than winning the Powerball lottery. Except that you don't want to win. It's so confusing!) :-)
*Data as reported by CDC to WHO; may not correspond at unit level to dates reported in US and even less to reports on popular news sources.