
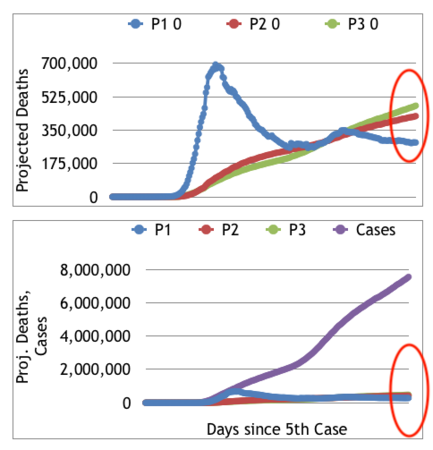
Multiple projections can be drawn from the same data. The blue line in the upper graph shows the number that would have been projected if the 14-day moving average number of deaths on each day since the 5th case was reported were used to project deaths through January 20 (Inauguration Day), ending with about 264,000.
The other lines show the number if the deaths are projected using each day's ratio of deaths to cases (red) or the overall average ratio of deaths to cases (green). The latter projection is just under 478,000 deaths.
The blue line, of course, is the basis of the "we're winning, we're winning" claims of the Administration during the late spring after the April wave in major coastal cities.
These projections are for data published by the World Health Organization, drawn from the US Centers for Disease Control and Prevention. Other more sophisticated projections show other numbers but are generally in the higher range. Why?
When one adds a line for the number of cases, it explains much of the discrepancy (red ellipses enclose same information). The known death rate is declining as we learn more about the disease, mainly due, one might argue, from more testing and heroic measures by the medical establishment, despite slow response by government actors. For those cases already known, a projection of almost inevitable deaths can be calculated, which one might call the "unsatisfied death rate." Sadly, this amounts to (478-211=) 267,000 more Americans as of Oct 8 who will not see the Inauguration, regardless of who wins.
In the absence of a vaccine and eventually a cure, a projection through the end of 2021, based again on the 14-day moving averages, suggests that about 526,000 of us will not celebrate New Years Day in 2022.
Headed out to the rally and then over to visit Grandma? You might want to rethink that.